I am testing this nice desktop tool called “Softanics Deleaker” (https://www.deleaker.com/). It was written by Artem Razin and, as you can deduce by its name, it is an application that helps the programmers to find memory leaks on C++, Delphi and .NET applications.
Starting this post, I will post several blog entries about my experiences using it and the features it exposes.
I installed it and installed the Visual Studio extension that ships with the installer. For my tests, I am using Visual Studio 2019 16.4 preview.
In Visual Studio I created a C++ console application and wrote this very simple and correct application:
int main()
{
    std::cout << "Hello World!\n";
    return 0;
}
When I run the local debugger, and since I have installed the Deleaker VS extension, the leaker will load all libraries and symbols of my application and will open a window similar to this one:
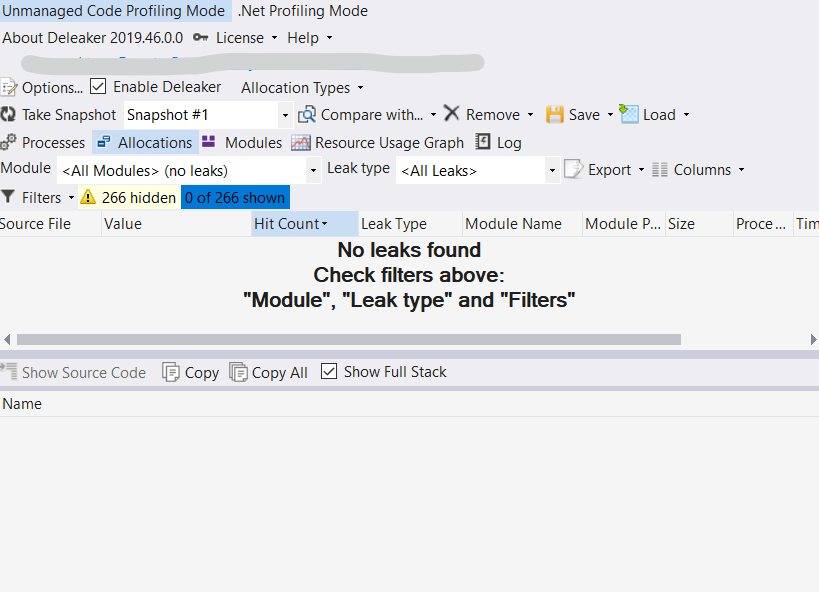
I still do not know what all those options mean, but the important thing here is the “No leaks found” message. The filter containing the “266 hidden” items refers to known leaks that Deleaker knows that exist in the Microsoft C Runtime Library.
Now, I will create a very small program too containing a small memory leak:
int main()
{
    for (int i = 0; i < 10; i++)
    {
        char* s = new char{'a'};
        std::cout << *s << "\n";
    }

    return 0;
}
As obviously observed, I am allocating dynamically one byte to contain a character and I am forgetting to delete it. When I debug it, I get this interesting Deleaker window:
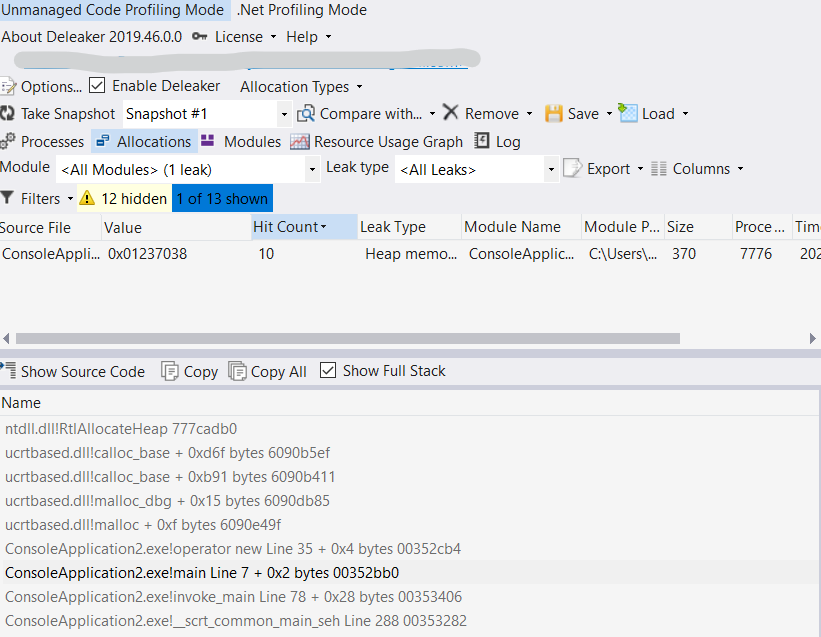
Now Deleaker detected my forgotten allocation and says that to me: “ConsoleApplication2.exe!main Line 7”.
As you can see, the “Hit Count” says that the allocation occurred 10 times (because my loop) and it says that 370 bytes leaked on this problem. Though that seems weird because I allocated only 1 byte 10 times, the 370 bytes appear because I compiled my code in Debug Mode and the compiler adds a lot of extra info per allocation. When I changed my compilation to Release Mode, I got the actual 10 bytes in the Size column.
When you click into the information table in the row containing the memory leak information, the Visual Studio editor highlights that line and moves the caret to such position (the new char{‘a’} line , so you realize where you allocated memory that was not released.
And that is it for now.
In next blog entries I will explore how to “Deleak” not so obvious things, how Deleaker behaves with shared pointers, COM objects, shared libraries, templates, virtual destructors and so on :)
Happy 2020!
